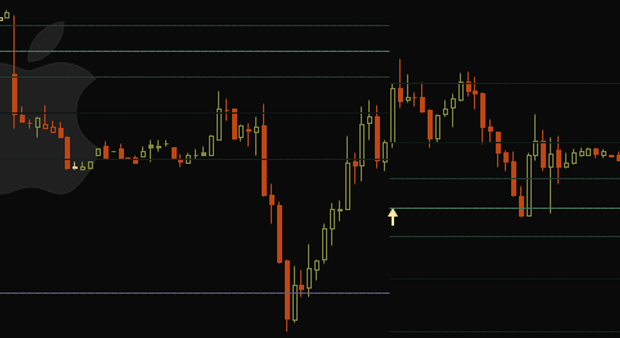
A lot of people have this idea that nebulous ‘market makers’ determine price, moving it up or down at whim for their own inscrutable purposes. I’ve heard people say that high-frequency trading algorithms are why Fibonacci lines work in trading. People love to attribute Intelligent Design to anything with a pattern, but in this case it’s just a byproduct of buyers buying low and selling high, and sellers selling high and buying low, all while the Fed mucks with interest rates.
The proof is that you can find these Fibonacci lines throughout the history of the stock market, far before high-frequency trading algorithms were a glimmer in the eye of their programmers. Technical analysis actually works worse now because so many traders try to exploit it for an edge. So it’s not market makers or algos or whatever God of the Gaps you try to ascribe it to, it’s just the same plain old math that governs galaxies and garden snails.
Snails, sunflowers, and stock prices each feature the Golden Ratio, a number that describes the simplest fractal you can make: it is the length of a line, when divided, that the ratio of the larger line to the whole line is the same as the ratio of the smaller line to the larger line. Do that with rectangles and you’ll see a spiral form.
The number is 1.618, and is found throughout the universe, because natural energetic systems will invariably either disappear or become oscillating chaotic systems. That sounds like a mouthful, but it really just describes random motion between two extremes. I wrote a study called Fibronacci that plots these fluctuating levels based on recent price action.
With a ratio so ubiquitous, it would be surprising if it didn’t appear in the price action of stocks. Buyers and sellers provide the constant pressure between extremes that make price action oscillate, and like ripples in a pond, these transactions can either cancel each other out or reinforce to create even larger waves. This is what ’emergent properties’ means. Why price jumps to a consolidation level and stews before jumping away again.
This ripple effect is the basis of a concept in technical trading called ‘confluence’ where you can have several signals converging in price and time that can have outsized influence over price action, plunging it to new lows or surging past old highs. But all of these price movements are to some extent predictable within a range of probabilities. This is how traders make money.
Think of it as lots and lots of people all looking at the same charts but seeing different things: sometimes when what they see makes them jump in will coincide with what you see, and when you both jump together you push price that much further. Big groups of people being chaotic often show remarkable order, such as being able to correctly predict elections or the number of jelly beans in a jar. Individual people may be able to influence some price action at smaller scales, but get enough people together and they become the Invisible Hand of the Market.
One of my favorite technical analysis tricks is using Fibonacci retracements to find potential pivots for price action. I’d never rely on just a -161.8% fib for an entry, but if it coincided with other important price levels then the probability of a pivot goes up, and it provides a convenient level off of which to risk capital. This is why I love my charts crusty with indicators.
The idea is you plot a fib from the last peak to the last trough and it will show you potential places you can think of like ripples in the pond. Though the 50% fib isn’t actually a fib and isn’t related to the Golden Ratio at all, it is often a convenient line to plot as the value center of oscillating price action.
You’ve seen oscillating price action as wedges, triangles, cup-and-handles or even just trend lines: they map out the edges of buyers and sellers making decisions based on recent historical price action and overall movement up or down. Traders use these to plan entries because they are little islands of predictability in chaos. As long as they are more likely to go one way than another you have an edge you can exploit to make profit.
Consolidation is where price action has reached a tipping point: it’s not clear to anyone whether the trend will continue or reject, so buyers and sellers trade until the tipping point is heavier on one side than another, then they all pile on and price predictably accelerates until it hits the next tipping point.
You can think of these as edges on a fractal or sea shore: as you zoom in closer and closer, rather than being able to predict whether that edge is on land or at sea, you only see more detail of the coastline, more jagged than it originally appeared. This is what is meant by fractal: mathematically repeating similarity at different scales.
In this sense, price action is fractal: technical analysis works on both daily charts and 1 minute charts (or even 47 minute charts!) because the price action is truly chaotic. Sure, FOMC can push price around, but it will do it in fairly predictable ways because once price finds a pivot it will bounce. You can’t necessarily predict how far or how fast, but once it creates patterns then it is predictable and thus exploitable.
The same math that makes a snail shell or sunflower seeds spiral in perfect proportions also governs price action through all time scales.

