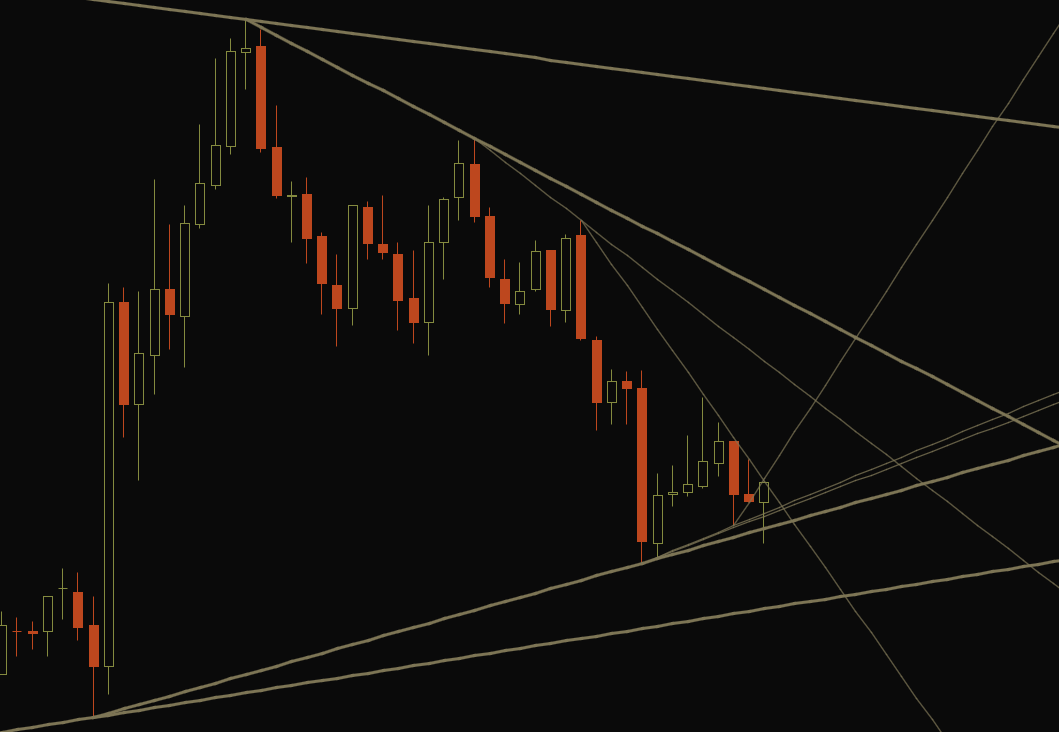
I’m not sure I’ve really explained how I draw trend lines. I’ve talked about the easy bit, literally *how* to draw them, but there are a few things I’ve learned about trend lines that make price action a whole lot easier to read.
For one thing, trend lines aren’t just there to be broken or rejected: they act exactly like horizontal support and resistance lines, just on a diagonal. This means price action can move through, re-test and continue on, or reject from the diagonals.
You can draw trend lines just about anywhere. The million-dollar question is, where will give you the most information about trend? And more importantly, how can you interpret that information in the form of entries and exits?
I draw trend lines from the highest wick to the next highest wick, and from that one to the next highest. I do it that way because I’ve found that price action will interact predictably with those lines, creating congestion areas in price movement. You can count on a trend line drawn this way to have some effect on price action, either stopping or at least slowing it down. Once you can predict price action, you can start to make trading decisions probabilistically.
The further away the initial peaks, the stronger the line. The earlier lines are stronger than later ones: the more vertical a line, the more likely it is to break. This is common sense, since vertical trend lines represent steep price changes, which never last long.
If two peaks are right next to each other, when it breaks I will often restyle it as a long dashed line, and not delete it since price may revisit it and respect it again later.
When price action breaks through a line I will restyle that line as a dashed line. This lets me know that it has been broken, and to watch it for a re-test. Once the next line breaks and holds, I will often delete the previous broken line.
Sometimes you’ll get a perfectly horizontal line, which I’ve taken to calling Flat Top (or Bottom) Breaks. This often coincides with another support/resistance line, either a round numbered price, or a previous strong level. When stronger lines break, the reaction is often much greater than usual. Again, being able to predict price movements will translate into better entries and exits.
In a stable trend, the trend lines should spline out evenly. If one is farther apart that suggests unsustainable price movement, and if they are too close together it suggests consolidation for a possible rejection.
Because they are an emergent property of an oscillating chaotic system, the trends are going to be related to the Golden Ratio (1.618) like galaxies and seashells. You can see this in action with my study Auto Trendlines, how it often produces new trends at regular intervals that increase often near multiples of 1.618 until they fall apart from being too vertical. If somehow price action could reverse in time on itself and continue the trend lines would look like a section of a Nautilus shell.
The line points should increase in frequency until the trend line is too vertical. Usually during a price surge you can tell where the peak is when the price action breaks a long vertical line. Price will often go up further, but that break signals the end of the meat of the move.
In practical terms, the way I use the trend line depends on where in the move it is, and whether the price action suggests a break or rejection. That’s impossible to explain but easier to see with ample screen time. But say we’ve just formed a peak, and price has attempted another surge up but fails; I draw the first trend line. At that point I’ll either jump in short or wait for the line to be tested again for a rejection entry. The risk is the line itself: if it breaks, the trend obviously wasn’t that strong.
The trick is to time your jump near the line and then watch for an exit. For me this usually involves finding confluence around a lower pivot and getting out there, but if I think it’s just a short-term reversal and stay in, then price action comes back up and breaks my line I will exit higher instead.
Alternatively, if price action breaks through the line but rides it down the top, I’ll wait for a divergence from the line to jump in long after the break. When price moves up after a move down, there will be an old lower trend line above it that will often reject. If it breaks and holds, you can stay in your calls.
My Auto Trend Lines study, like all my price action studies, was borne out of automating technical analysis that I was already doing. It isn’t a substitute for that technical analysis, and I’ll often re-draw broken trend lines that the study won’t draw anymore because that line is stronger for whatever reason. It’s tough to program that kind of discrimination into code, but my intention is not for these studies to replace understanding, rather to enhance learning.
I’d love to hear about how you find trend lines helpful.

